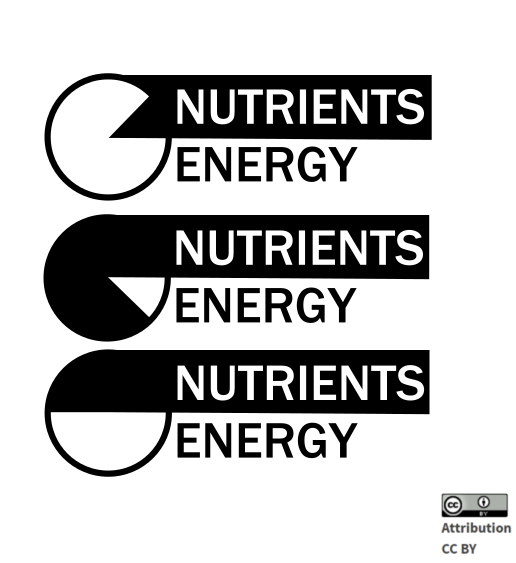
 graphic for food packaging. draws consumer's attention to this food's nutrients (vitamins, minerals, essential acids, etc) vs energy (sugar, fat, etc). ratio illustrated by pie chart is relative to all other foods. there's a version you can play with here https://docs.google.com/drawings/d/1fOpEtEDPi-Nztx8lp4BF7-3vLKUvnBbqZHmLjrRl3Pg/edit
on_scoring_graphic_v1
Be First to Comment